


Comprehensive Guide to Performing Churn Analysis
You are running a subscription service, a gym, an online store, or even a learning platform. Things are going well, new customers are coming in. But after a few months, people start dropping off one by one. That’s churn. And if you're not paying attention, it can drain your revenue faster than you think.
But the good thing is you can see it coming.
That’s where churn prediction steps in, your business’s early warning system.
What is Churn prediction?
Churn prediction is the process of identifying customers who are at a high risk of churning in the future. The goal is to flag customers who are likely to churn before they actually do, allowing the business to take steps to retain individuals with a high risk of churn.
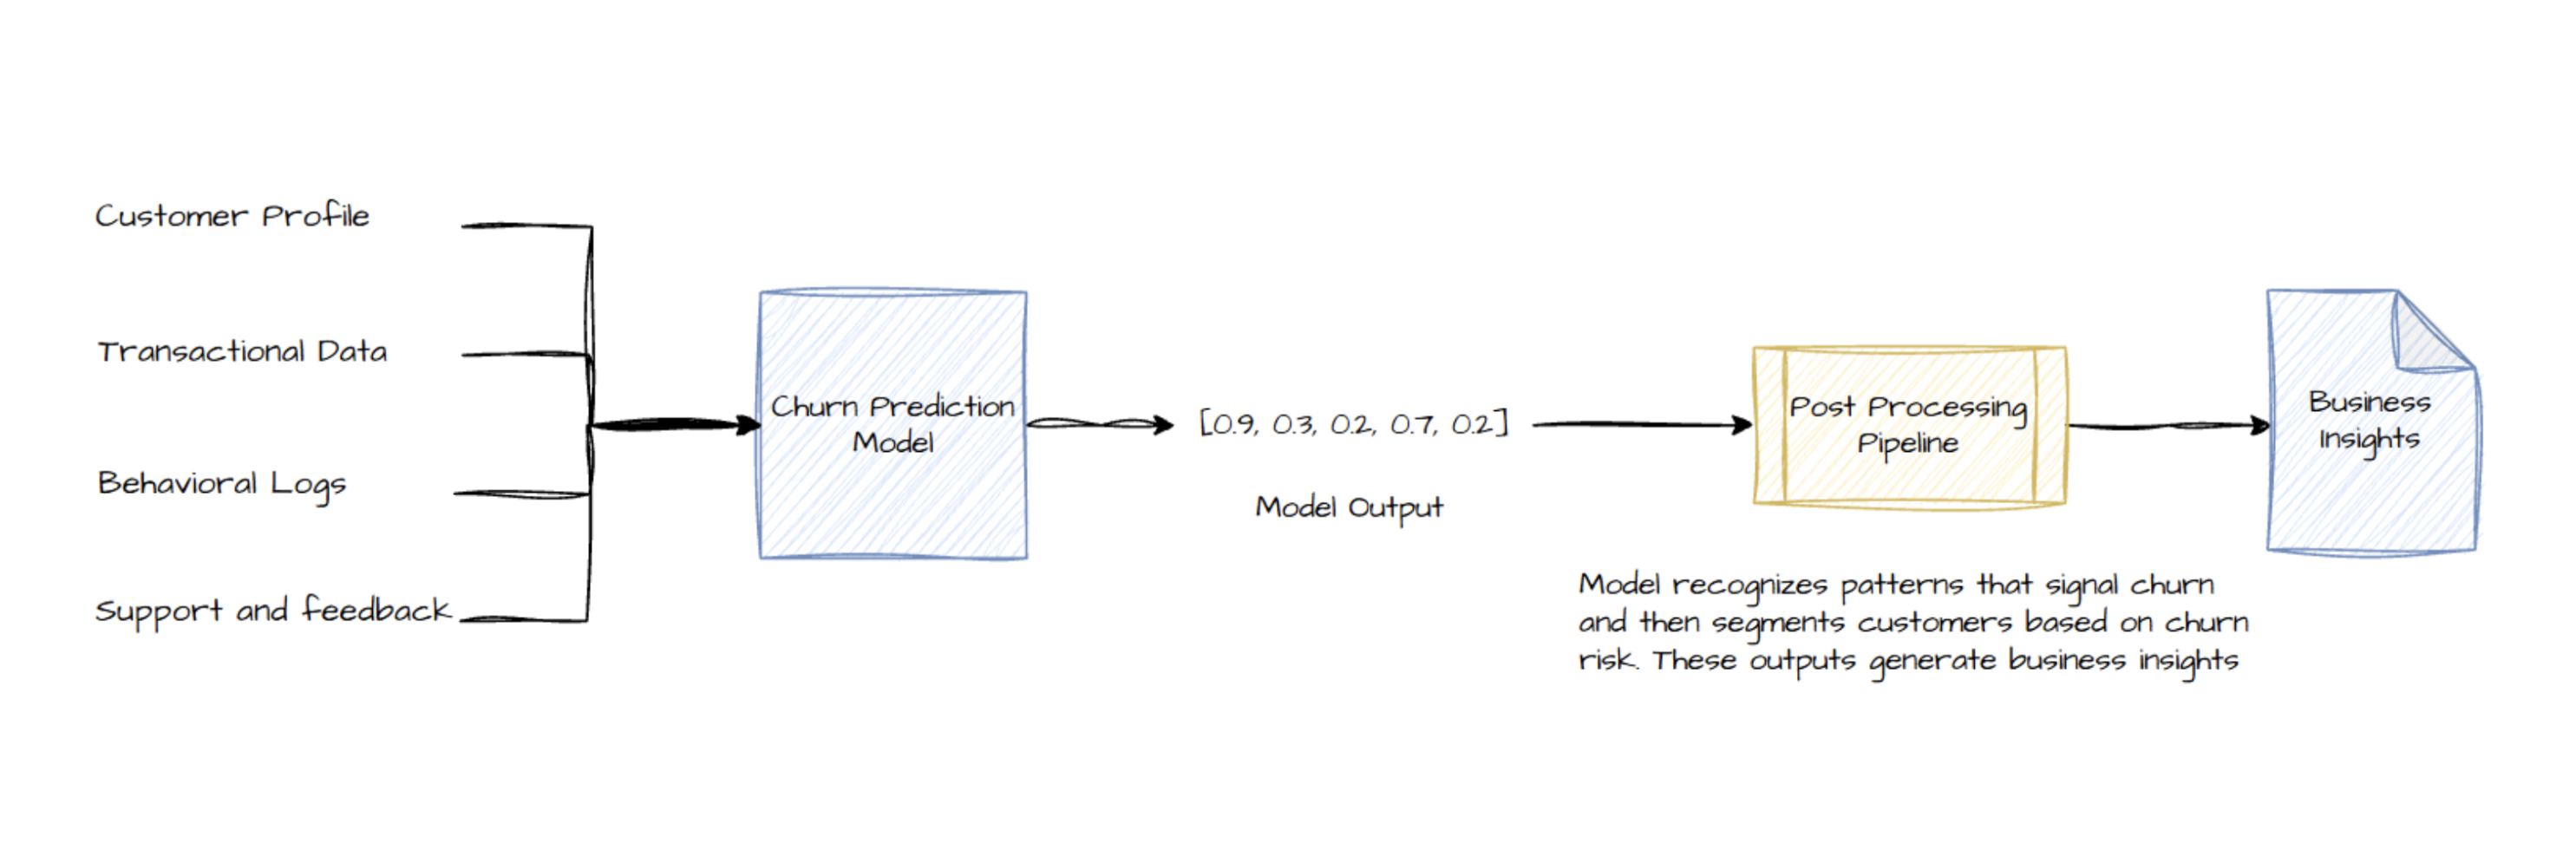
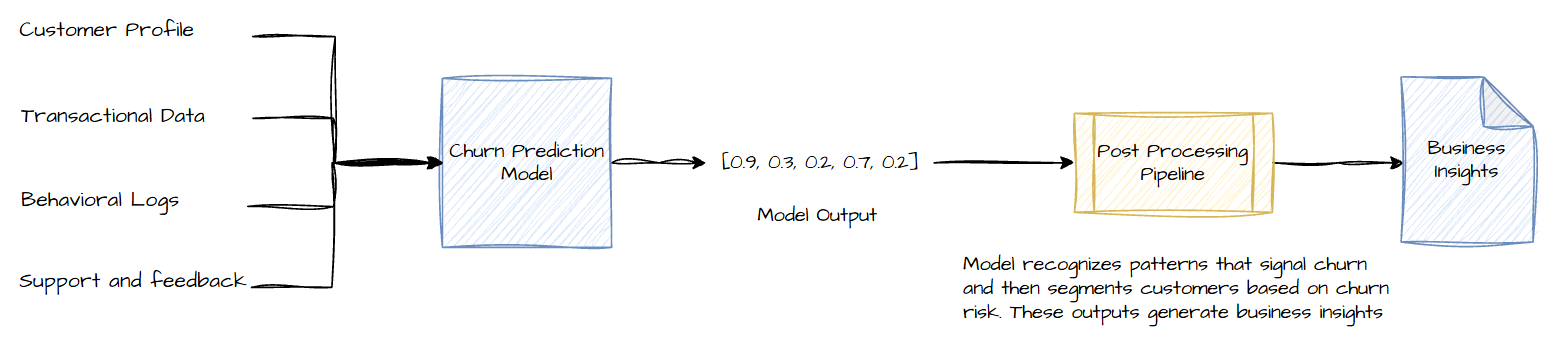
At a high level, churn prediction works by analyzing historical customer data such as behavior, transactions, and engagement. Machine learning models are trained to recognize early signals that often precede churn, like a drop in activity, reduced spending, or negative support interactions. Once trained, the model can assign a churn risk score to current customers, helping the business prioritize those most at risk.
Why do companies need Churn Prediction?
Churn prediction is critical for any business aiming to maintain growth and strengthen customer relationships. Rather than responding after a customer has already left, predictive models allow companies to intervene early and minimize the risk of attrition. This shift from reactive to preventive strategy improves long term profitability and enhances the overall customer experience.
At the core of this approach is the fact that retaining customers is significantly more cost-effective than acquiring new ones. Multiple studies confirm that even a small increase in retention can result in disproportionately large improvements in profit margins.
For example, a five percent increase in customer retention has been associated with profit boosts ranging from twenty five to ninety five percent. This efficiency makes churn prediction not just a technical tool but a strategic business asset.
Understanding and Acting on Churn Drivers
Churn rarely occurs without warning. Behavioral signals such as decreased engagement, frequent complaints, or limited feature usage often precede customer exits. Churn models help surface these patterns in advance, allowing teams to act before the risk materializes.
This insight is valuable across several business functions. For product teams, identifying the features or touchpoints associated with high churn enables targeted improvements in design or usability. Marketing can craft messaging that resonates with high risk customers by focusing on the aspects of the product they are most likely to find valuable. Customer success and support teams can also use these insights to prioritize outreach and offer proactive assistance to those exhibiting signs of dissatisfaction.
By using churn understanding into operations, companies can adapt and create a more responsive service environment, ultimately reducing churn and improving user satisfaction over time.
Optimizing Retention Efforts and Financial Planning
Churn prediction also enhances how businesses allocate resources. Without it, retention strategies often rely on blanket approaches that treat all customers equally. This results in inefficient use of time, budget, and personnel. With churn scores in place, retention efforts can be prioritized toward the most at risk customers, making interventions more precise and effective. Whether through targeted discounts, personalized engagement campaigns, or prioritized support, businesses can apply the right strategy to the right customer at the right moment.
From a financial standpoint, churn models contribute to greater planning accuracy. High churn rates reduce stability in forecasting, particularly for subscription based or businesses dependent on repeat purchases. Predictions help analysts set realistic growth expectations, manage budget allocations, and prepare contingency plans with greater confidence. They also support a more predictable revenue stream, which is crucial for long term strategies.
Additionally, reduced churn naturally lowers acquisition pressure. Since acquiring new customers is often several times more expensive than retaining existing ones, a well functioning churn prediction system can directly reduce marketing and sales expenditure. Long-term customers are also more likely to contribute to organic growth through referrals and advocacy, creating further downstream benefits without added cost.
Applicability Across Sectors
Although the primary focus here is on retail and e-commerce, churn prediction methodologies are relevant across many industries. In telecommunications, software as a service, banking, digital media, and utility services, customer retention plays a central role in revenue stability. The economic impact of churn is consistently significant. Accurate forecasting and timely intervention are thus essential across all customer-centric industries.
How to Build a Churn Prediction Model
A good churn model lets a company intervene (with special offers or support) before customers go, protecting revenue and growth.
Building such a model involves several clear steps: gathering the right data, turning it into useful features, choosing the right algorithm, and carefully evaluating the results. Each step shapes how well the model will work in real business settings.
Data Collection
The first step is gathering data from all relevant sources. Think of every way you interact with your customers:
- Customer Profile: Demographics like age, location, or account type can influence churn.
- Transaction History: Records of purchases, subscription changes, or payment failures.
- Behavioral Logs: Usage data (e.g., login frequency, pages visited, support chat logs) show engagement levels.
- Support & Feedback: Help tickets or complaint logs can signal dissatisfaction.
Combine data from systems like CRM, billing, and web analytics so each customer’s history is complete. Ensure consistent customer IDs and timestamps across sources so data aligns correctly. In practice, this means cleaning and linking tables so every purchase or support call matches the right customer record.
Once collected, look at distributions of key variables or how churners differ from others. You might find churners tend to log in less or have lower lifetime value. This initial analysis helps verify the data quality and suggests which factors are important.
Feature Engineering
Raw data must be transformed into features that a model can use. In business terms, features are metrics that capture customer behavior and value. Accurate churn prediction models depend heavily on the quality and relevance of the input features. These features should reflect customer behavior, engagement, financial patterns, and satisfaction over time. The goal is to extract signals that precede churn events, enabling early intervention. This section organizes the most effective feature types into categories, describing their rationale and interpretation, and implementation.
RFM Features (Recency, Frequency, Monetary Value)
The RFM features standing for Recency, Frequency and monetary, is one of the most widely used approaches to capture customer behavior, particularly in churn prediction and segmentation tasks.
Recency captures how recently a customer engaged with the product or service. This could be days since their last login, purchase, or session. It is a critical feature because churn often follows a decline in activity. For instance, a user who hasn’t logged in for 60 days is more likely to churn than one who used the platform yesterday. Declining recency is a common early warning sign, especially for previously active users.
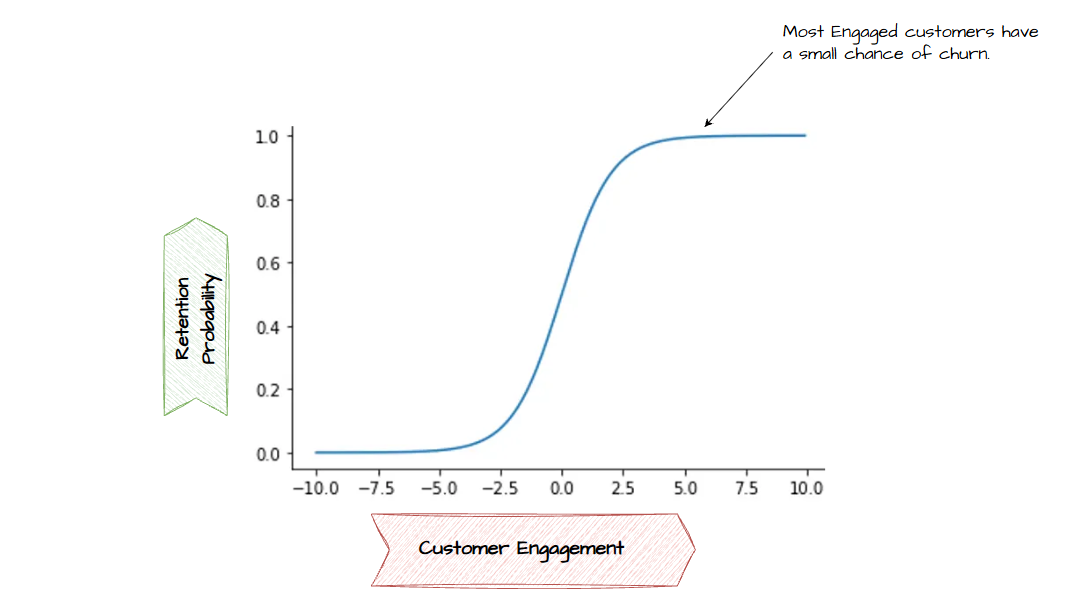
Frequency measures how often a customer engages over a defined period, such as logins per month or purchases per quarter. High-frequency users are typically more engaged and less likely to churn, as frequent use suggests the product delivers ongoing value. A sharp drop in frequency, even if recency is recent, can still indicate waning interest.
Monetary value reflects how much a customer has spent, either in total or over recent intervals. In subscription models, this could be average monthly revenue; in transactional models, cumulative spend. A decline in monetary value may signal reduced perceived value or intent to downgrade. For example, smaller orders or a shift from premium to basic plans may precede churn. Conversely, high-value users may stay despite lower engagement due to their investment.
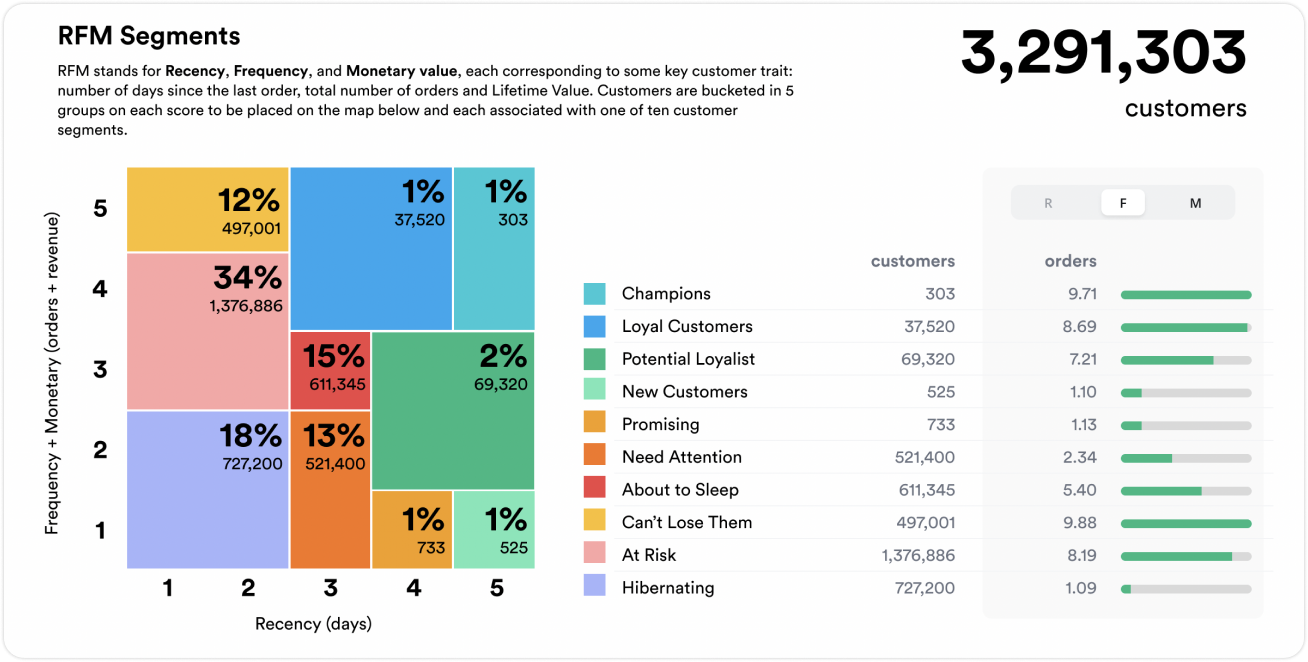
These RFM metrics can be used individually or in combination to segment users into behavioral cohorts like champions, at-risk users, or lapsed customers. Each segment can then be targeted with appropriate retention strategies.
Engagement and Usage Behavior
Engagement features go beyond recency and frequency to capture how users interact with the product. They track behavior over specific time windows, reflecting usage depth, session quality, and interaction diversity. This includes active usage metrics such as number of sessions, screen views, feature clicks, or time spent on the platform over the past 7 or 30 days. A decline in usage hours or session counts may signal fading interest, while an uptick may reflect renewed satisfaction after a product update or offer.
More granular signals include how often specific modules or tools are used. For example, on a SaaS platform, reduced use of a core feature like dashboards might indicate declining reliance. Consistency or variability in engagement is also informative. Metrics like engagement slope, which reflects momentum, or rolling averages of session count help track trends. A flat or downward slope can be an early churn signal even when activity levels are moderate.
Engagement features help models understand how embedded a product is in a user's routine. A drop in time spent or lack of exploration may indicate disengagement. When modeled well, engagement often correlates strongly with retention and gives early warning before frequency declines.
Transactional Behavior
Changes in financial activity are strong predictors of churn in subscriptions or e-commerce. Average order value, calculated over a recent window, reflects transaction size. A sustained drop can signal reduced interest or budget limits. Purchase frequency over a recent quarter or year helps assess customer commitment, with fewer purchases suggesting waning satisfaction.
Tracking subscription changes like downgrades, removed features, or shorter contracts is especially useful, as these often precede churn. Payment issues such as missed or delayed transactions frequently lead to involuntary churn if not resolved quickly. These features closely reflect customer intent and are essential to churn models.
Support and Satisfaction Signals
Customer frustration often shows up in support data. An increase in tickets, help requests, or unresolved complaints often reflects dissatisfaction. Sentiment from support transcripts, reviews, or chat logs can flag declining experiences.
Survey-based metrics like Net Promoter Score (NPS) and Customer Satisfaction (CSAT) offer structured feedback. A downward trend in these scores often signals increased churn risk. Support features help differentiate between customers who are confused but can be retained and those genuinely frustrated. Combined with engagement or RFM signals, they help models understand intent, not just usage.
Demographic and Contextual Features
Demographic and account features capture static traits like age, region, plan tier, device, or tenure. While not dynamic, these help contextualize churn drivers.
Customer type, subscription tier, or service bundle often correlates with churn. For instance, users on basic plans typically churn more than those on premium ones. Geographic and demographic factors like location or language highlight behavioral differences across groups. Acquisition channels such as organic search, paid ads, or referrals influence loyalty, with different sources yielding different churn rates.
These features are critical for adjusting for population effects and identifying high-risk user segments. Well-engineered features make even simple models effective by surfacing meaningful patterns in data. They support both churn prediction and the design of retention strategies.
Model Selection
With features ready, the next step is choosing a predictive algorithm. No single model is best in every situation. The choice depends on factors like desired interpretability and data complexity.
Logistic Regression
Logistic regression is a linear model that outputs a probability of churn. It is highly interpretable because each feature receives a weight indicating its impact on churn risk. It trains quickly, scales to very large datasets and integrates easily into real‑time systems. As a baseline it is often the first model to try. Its limitation is that it assumes a linear relationship between features and the log‑odds of churn, so it may underperform on complex, non‑linear patterns.
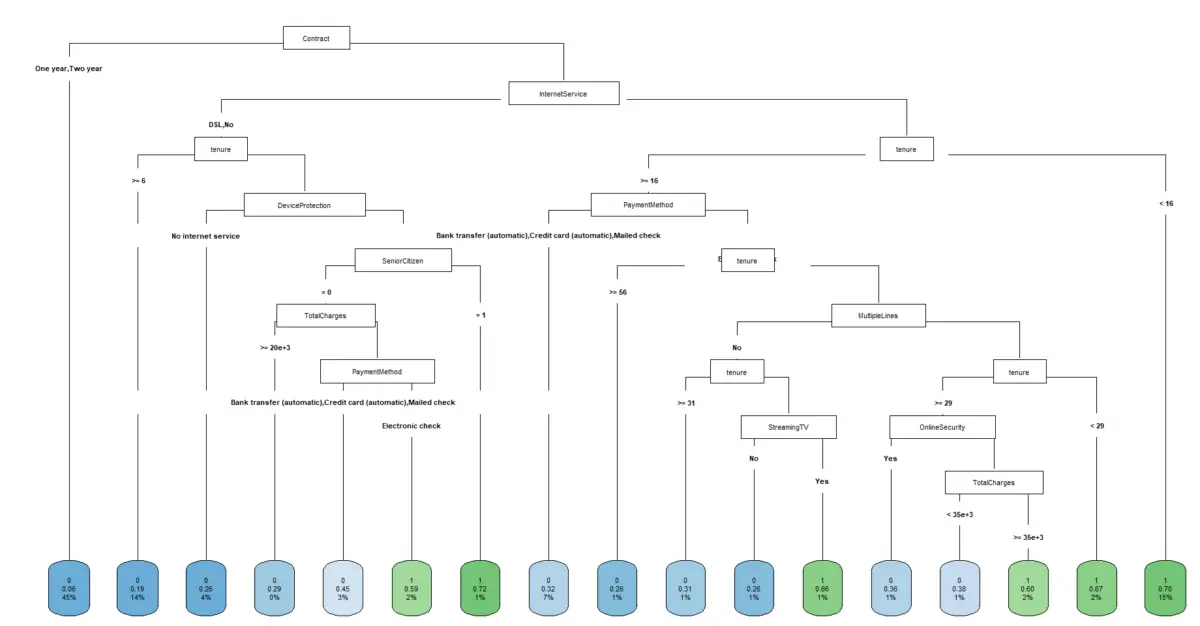
Decision Trees
Decision trees classify customers by creating a series of clear, rule-based decisions. These rules are easy to follow and explain to non-technical stakeholders, making trees highly interpretable. They can naturally model non-linear relationships and interactions between features. However, a single decision tree can easily overfit the training data, capturing noise instead of real patterns, which may limit its predictive accuracy on new data. Still, decision trees are a solid choice when you need transparent, easy to communicate models and want to understand the logic behind churn predictions.
Random Forests
This model builds many decision trees and averages their predictions. Unlike traditional linear models, it excels at capturing complex, non-linear relationships between customer behaviours and churn likelihood. Random forests use ensemble approaches of multiple trees, minimizing the risk of overfitting, ensuring that the model performs well not only on training data but also on unseen customers. Each tree in the forest considers random subsets of features which makes the model robust, even when certain data points are noisy or incomplete. However, this ensemble approach reduces interpretability, it's no longer easy to say ‘this feature caused churn without additional tools like SHAP. They also require more computing resources, especially on large datasets. Still, they strike a strong balance between performance and generalizability, making them a top choice for many churn prediction systems.
Kaplan-Meier Survival Analysis
Survival analysis models view churn as a time to event process rather than a classification problem. Unlike traditional models that ask whether a customer will churn within a given window, survival models aim to estimate the probability that a customer will remain active at a future time. They also handle censoring, which happens when a customer hasn't churned by the end of the observation period. This approach avoids bias and gives more useful insights, like the probability a customer stays for 6, 12, or 24 months or computing the median customer lifetime.
The Kaplan–Meier (KM) estimator is a method used to estimate the survival function, which gives the probability that a customer is still active and has not churned at time t. It creates a stepwise survival curve, starting at probability 1.0 and dropping at each observed churn event. The survival function is defined as:
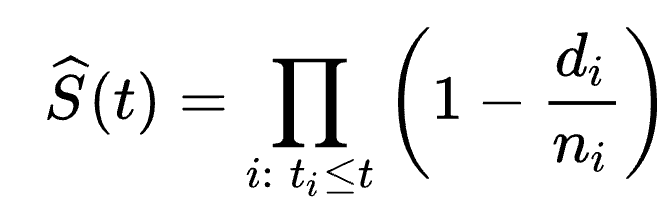
with ti a time when at least one churn event occurred, di the number of customers who churned at time ti, and ni the number of customers who were still active (had not yet churned or been censored) just before time ti .
The Kaplan–Meier method makes no distributional assumptions and is easy for visualizing and comparing survival curves across customer segments. It assumes that survival times are independent, meaning one person churning doesn’t directly affect another, and that censoring is uninformative, meaning customers who haven’t churned are not different from those who did at the same tenure.
import pandas as pd
from lifelines import KaplanMeierFitter
# Load data and preprocess
df = pd.read_csv("Telco-Customer-Churn.csv")
df['churn_event'] = df['Churn'].map({'Yes': 1, 'No': 0})
#Create a KaplanMeier object
kmf = KaplanMeierFitter()
#Calculate the K-M curve for all groups
kmf.fit(df['tenure'],event_observed = df['churn_event'],label = "All Customers")
#Plot the curve and assign labels
kmf.plot()
plt.ylabel('Probability of Customer Survival')
plt.xlabel('Tenure')
plt.title('Kaplan-Meier Curve');
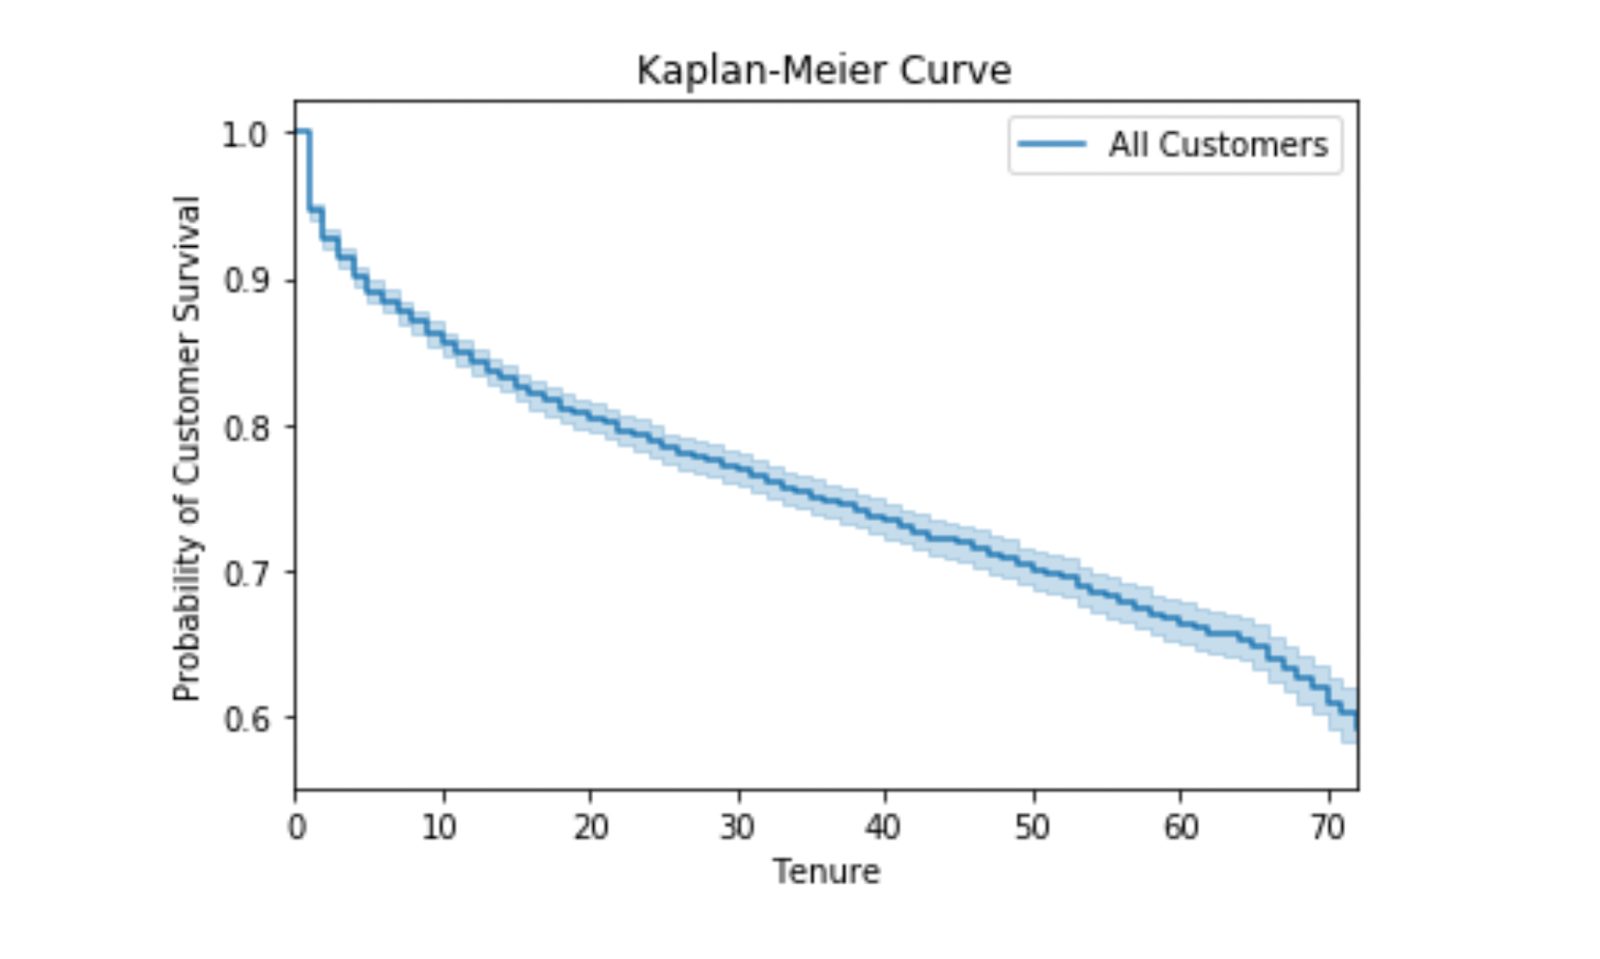
The above example uses the IBM Telco Churn dataset and estimates customer retention as a function of tenure. Sudden drop in the starting says that after one tenure only customers start churning and over time that churning rate decreases. It can be extended to compare curves across different subgroups.
Cox Proportional Hazards Model
The Cox Proportional Hazards is a survival regression model that relates customer features (covariates) to churn timing. The model uses customer features and finds how each factor influences churn. Whereas Kaplan-Meier is used to estimate the probability of survival, Cox Proportional Hazards is used to estimate the hazard ratio. The hazard ratio represents the difference in hazard that exists between two individuals (or groups). The hazard is essentially the inverse of survival, or the probability of failure. Kaplan-Meier estimates the probability of survival whereas Cox Proportional Hazards estimates a hazard ratio. As long as you have one, you can calculate the other.
The Cox Proportional Hazards equation states that the hazard ratio is the product of two terms: the baseline hazard and the partial hazard.
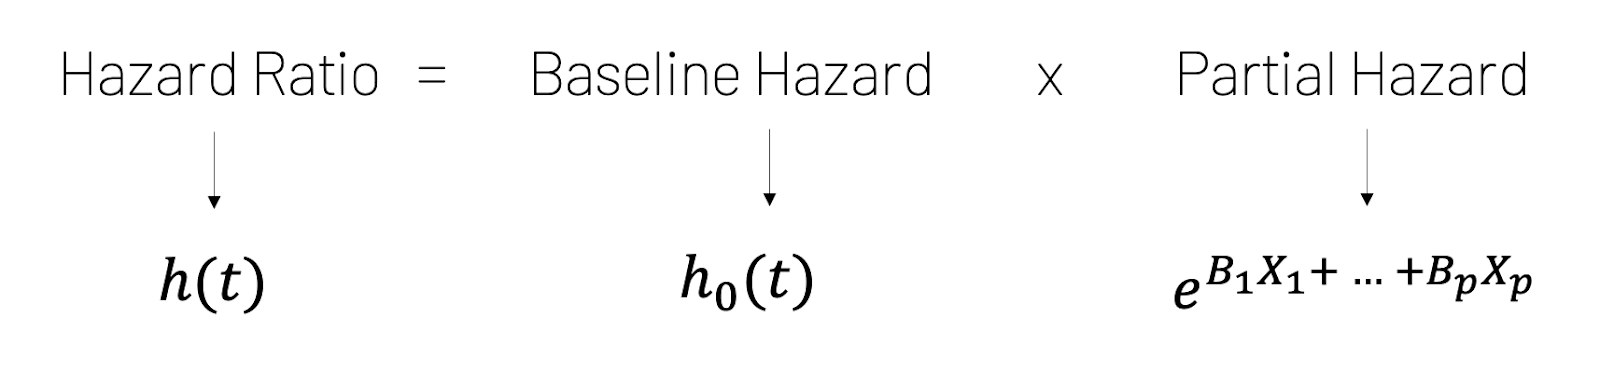
The baseline hazard is simply a baseline. It's the hazard that exists when each variable is set to some specific value.The partial hazard represents the change in the hazard that occurs when the value for a variable is different from the baseline. The primary assumption is proportional hazards, meaning the effect of a feature on the hazard is constant over time.
The Cox Proportional Hazards model was fitted on IBM Telco churn data to understand and assess how it performs in modelling customer churn prediction.
import pandas as pd
from lifelines import CoxPHFitter
import matplotlib.pyplot as plt
df = pd.read_csv("Telco-Customer-Churn.csv")
# Preprocess features for Cox model
regression_df = datapreparation(df)
# Fit Cox Proportional Hazards model
cph = CoxPHFitter()
cph.fit(regression_df, duration_col='tenure', event_col='Churn')
# Print model summary
cph.print_summary()
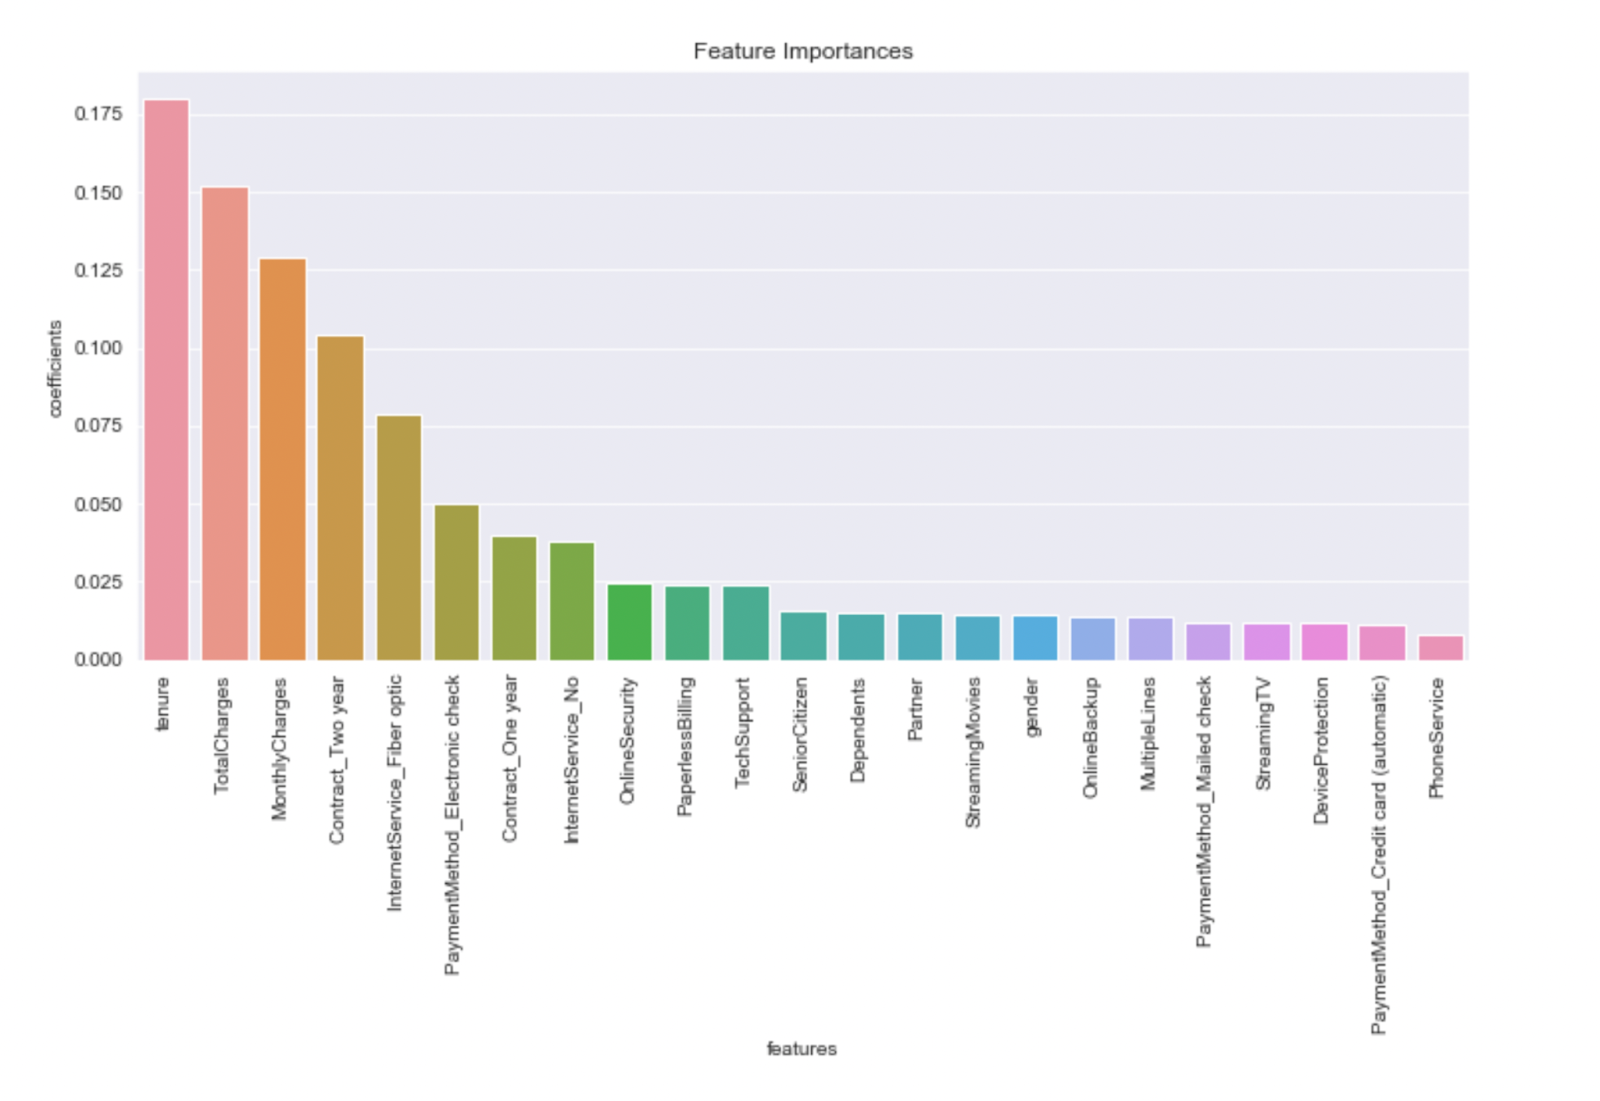
# Plot feature coefficients
fig, ax = plt.subplots(figsize=(10, 7))
cph.plot(ax=ax)
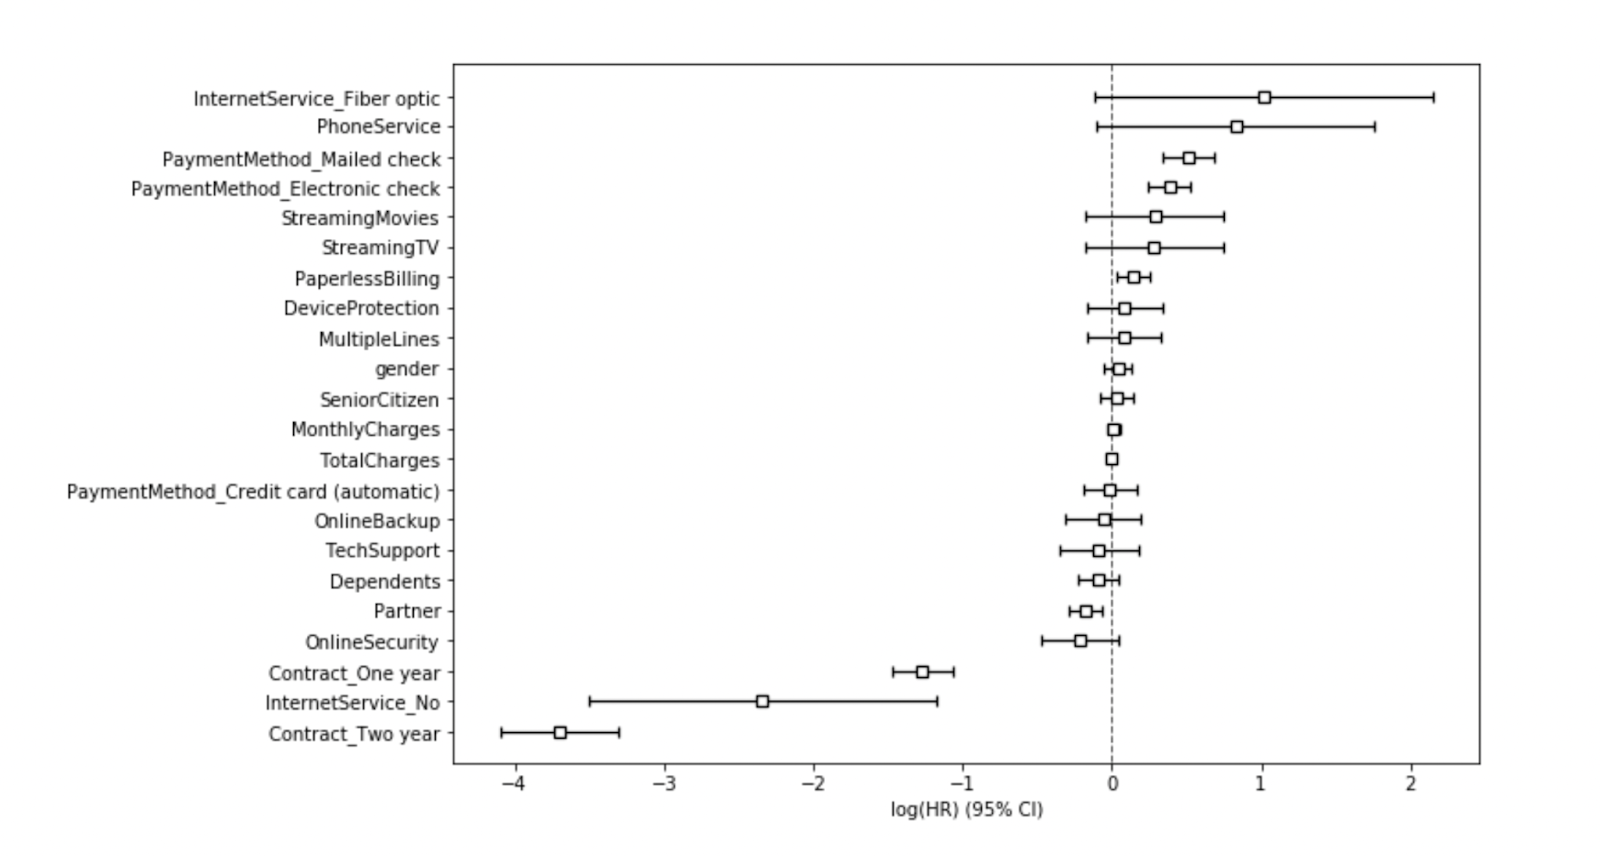
The coefficients show how each feature affects churn risk in relative terms. A log hazard ratio greater than 0 means the feature increases churn risk. For example, higher monthly charges often correlate with a higher chance of churn. A log hazard ratio less than 0 means the feature reduces churn risk.
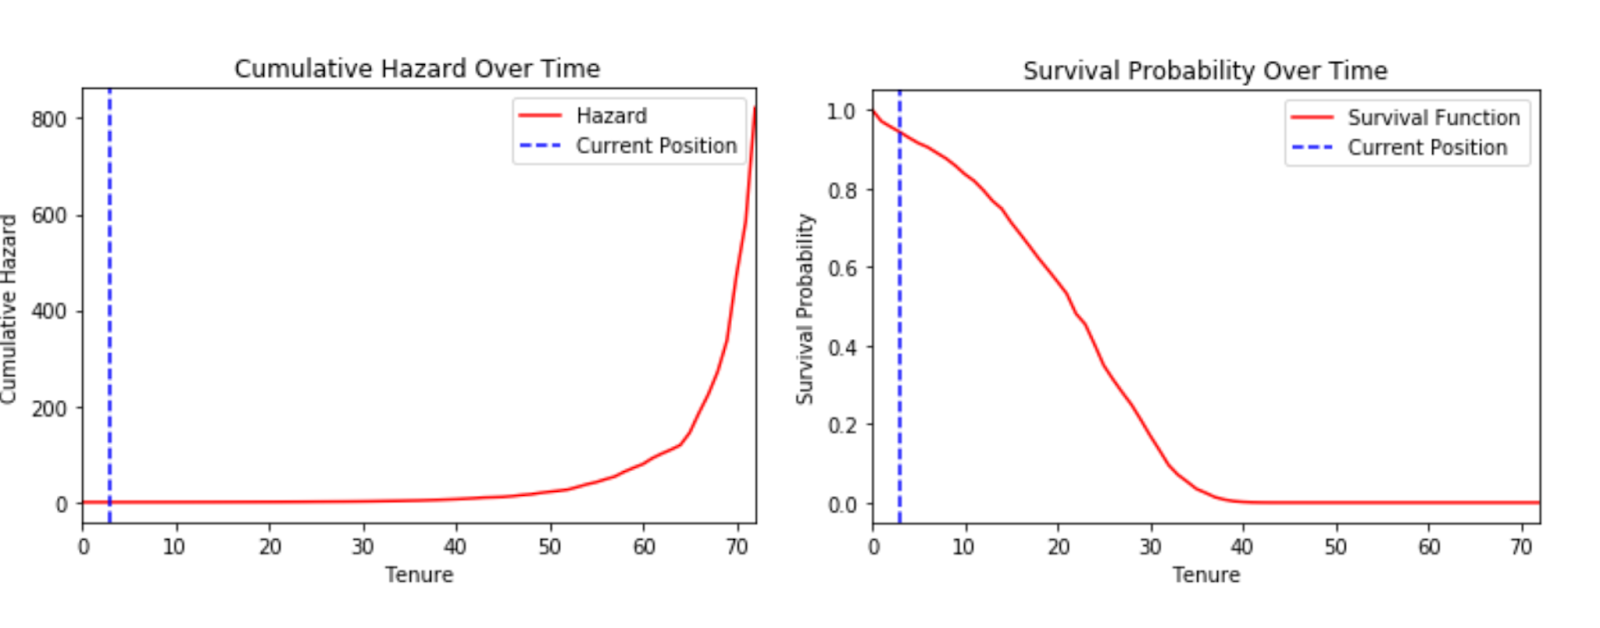
The plots above depict Cumulative Hazard and Survival Probability over time. The sharp drop in survival probability between 20 to 40 months suggests that many customers are leaving during this period. Similarly after around 40 months, the cumulative hazard slope becomes steeper, depicting accelerating churn risk.
When selecting a model, balance interpretability, predictive power, and how it will be used in production. Models with high interpretability are easier to audit and explain but may underperform on complex patterns. Conversely, more accurate models often require more computational resources and lack transparency, making them harder to monitor or trust without explainability tools.
Model Evaluation and Metrics
After training, you must evaluate how well the model works. In churn problems, raw accuracy (overall percent correct) can be misleading because churn events are relatively rare. For instance, if 90% of customers don’t churn, a model that predicts “no churn” for everyone is 90% accurate but completely useless.
Instead, focus on metrics that capture the business goal of catching actual churners:
- Precision: It tells us what fraction of the customers predicted to churn actually did. High precision means resources won’t be wasted on targeting customers who wouldn’t have churned, avoiding unnecessary allocation of resources.
- Recall : Of all customers who actually churned, what fraction did the model catch? High recall ensures you identify most at-risk customers. Missing a true churner (a false negative) can be very costly.
- F1-Score: The harmonic mean of precision and recall; it balances the two.
- ROC-AUC (Area Under the Curve): This measures how well the model ranks customers by churn risk. An AUC close to 1 means the model can distinguish churners from non-churners across all thresholds.
For churn prediction, precision and recall are often more informative than plain accuracy. You may also use a confusion matrix to see the counts of true/false positives and negatives. From a business view, consider a cost sensitive example, failing to prevent a high value customer's churn (false negative) may result in a greater loss than attempting to retain a low risk customer who would have stayed anyway (false positive).
Cross validation (testing the model on multiple train/test splits) is also important. It ensures your model’s performance is stable and not just luck on one split. Finally, Finally, metrics should be contextualized in terms of business outcomes. Rather than reporting scores, quantify how many customers the model helps retain, or how much revenue it protects compared to a random or untargeted approach. This translation from statistical evaluation to business value enables businesses to pinpoint weaknesses and take focused steps toward improving.
Model Comparison
Different algorithms offer varying strengths in terms of interpretability, accuracy, and scalability. These trade-offs must be considered in light of business goals and the nature of available data.
When you want high interpretability, you can rely on models like logistic regression, decision trees, and survival analysis. Logistic regression provides clear feature weights and works well when the relationships are mostly linear. Decision trees are intuitive and offer rule based splits that are easy to explain. Kaplan-Meier curves and the Cox model, while part of the survival analysis family, also provide transparency either through visual churn timelines or clear coefficients that show how each factor affects churn risk.
When the data becomes more complex or the relationships are non-linear, logistic regression tends to underperform. In such cases, survival analysis and ensemble methods like random forests offer better accuracy. Random forests are particularly effective at capturing complex interactions and handling noise, with some trade off in transparency. Survival models, especially the Cox model, can still retain interpretability while adapting to more intricate data structures.
Overfitting is a challenge particularly with decision trees. Pruning and validation help, but accuracy may still be limited. Random forests reduce this risk making them more reliable, though heavier to deploy. Survival models aren’t typically used for classification, but when timing matters, they provide unique insights that are both strategic and actionable.For example, Kaplan-Meier curves are straightforward plots of churn probability over time, and Cox models let you interpret each factor’s effect on churn risk.
Ultimately, model choice should reflect not just the structure of the data but the kind of insight the business needs whether it’s who will churn, why they churn, or when they are likely to churn. Model selection should align with business priorities. If transparency is essential for communication, an interpretable model such as logistic regression, Survival models or decision trees is appropriate. If the goal is to maximize predictive performance in complex data settings, ensemble models or survival models may be more effective. For large scale deployment, models must also be fast and efficient. The optimal strategy is to evaluate multiple models, assess their performance on relevant business metrics, and select the one that best aligns with ones business model.
Using Churn Predictions for Business and Marketing Optimization
Predictive churn models allow businesses to identify customers at risk of leaving and intervene strategically. Since retaining an existing customer is significantly more cost-effective than acquiring a new one, churn scores help prioritize efforts. After scoring, customers are segmented into risk cohorts such as high, medium, or low churn probability. Actions are then tailored to each segment. For example, a segment of VIP customers showing reduced activity may be prioritized by the customer success team for retention interventions.
Targeted Retention Campaigns
Once high-risk segments are defined, proactive outreach becomes essential. These cohorts should be engaged with targeted retention campaigns that include personalized incentives and optimized offers.
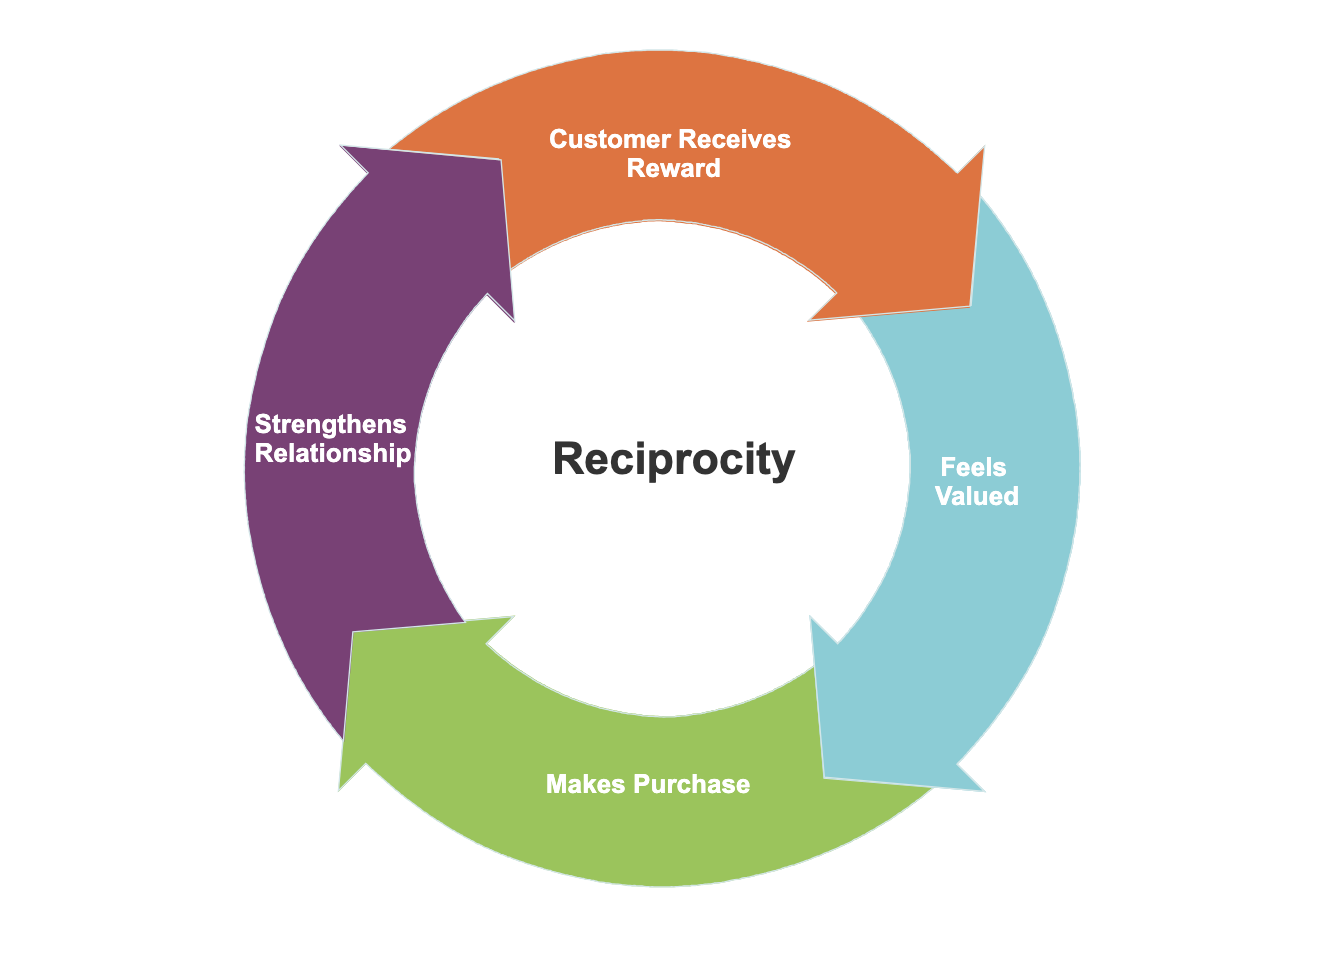
Personalized Incentives are based on the customer's prior behavior. For instance, customers who leave a one- or two-star review are automatically sent a coupon for their next purchase. Other forms include loyalty points, upgrade offers, or access to premium content. Such personalization makes customers feel valued and can reverse attrition.
Coupon and Offer Optimization: To avoid wasting marketing spend on ineffective promotions, combine churn risk scores with “redeemability” models. Using dual prediction approaches, one predictive model identifies customers at high risk of churn, while a second model evaluates each customer's likelihood to redeem retention offers. By only sending coupons to those who were both likely to churn and likely to redeem the offer, the company cut costs and retained more customers. In practice, a retailer might first flag customers who haven’t shopped in months (higher churn risk), then filter that list by who’s historically used coupons. Only this intersection receives the coupon code. The same principle applies to free shipping, bundle deals, or trial extensions: target them with data-driven precision. This data-backed approach yields much higher ROI than blanket promotions (up to 30–50% lift in engagement is possible when targeting is precise).
Feature-Driven Engagement
Churn models can highlight which features or behaviors contribute to customer retention. If the model shows that reduced usage of a specific feature is associated with churn, businesses can respond with targeted communications. For example, users who stop using a key feature might receive an in-app message or email with a tutorial or guide explaining its value. This approach helps reestablish engagement and demonstrates the product’s relevance.
Additional strategies include personalized recommendations and cross-sell opportunities. If customers who previously bought some accessories stop doing so, the business might send curated suggestions to encourage repeat purchases. Similarly, content platforms can notify users when new material is available in a genre they previously consumed. These interactions are guided by model outputs that identify which features are most closely tied to retention.
Onboarding and Support Enhancements
Churn prediction is especially useful during onboarding. Many customers disengage shortly after sign-up if onboarding is ineffective. For example, a high proportion of new users abandon products within the first week if setup is confusing or incomplete. Churn scores can help flag these users early.
Accelerated Onboarding involves monitoring early activity. Users who stall during setup or ignore key tasks can be enrolled in onboarding programs. This may include walkthroughs, webinars, or direct outreach by the customer success team. The goal is to address early obstacles before the user disengages completely.
Priority Support ensures that high risk users receive prompt assistance. When a customer with a high churn probability submits a support request or shows signs of inactivity, the system can trigger a follow-up by the support team. Timely, personalized support often resolves issues before they lead to churn.
Loyalty and Lifecycle Programs
Churn risk insights can inform how and when to offer rewards. Loyalty programs can be adapted to deliver value to customers who are at risk. For example, if a long-time VIP customer suddenly shows churn signals (e.g. spending dips), the company might bump them up to the next loyalty tier or send an exclusive “we value you” gift.

Common tactics include tiered rewards, points bonuses, and referral incentives targeted by churn score. For instance, a retailer might double the loyalty points earned on the next purchase for any customer in the high risk segment. Or a subscription service could give at risk members a free add-on (like a month of premium content) if their engagement has dropped. The goal is to reinforce the value of staying, even small perks can help retain wavering customers. Over time, these loyalty boosts translate into higher lifetime value and lower churn.
Sales, Customer Success, and Product Strategy
Churn scores are also used by sales and customer success teams to prioritize outreach. In B2B or high-value accounts, automated CRM alerts can notify account managers when churn risk exceeds a threshold. This allows the team to intervene with direct outreach, address concerns, and propose tailored solutions.
Product teams can use aggregated churn data to improve features and address usage gaps. If customers consistently disengage due to missing functionality, that insight can inform roadmap prioritization. For instance, if a feature is underutilized among churn-prone users, redesign or additional training might be warranted. In some cases, pricing plans may need adjustment if usage ceilings lead to customer exits.
Example Workflows
Churn prediction can be integrated into end-to-end workflows across various industries.
In retail e-commerce, a churn model identifies customers who have not purchased in six months. These customers are further filtered by a redemption likelihood model. Those who qualify receive targeted offers such as discounts or free shipping, resulting in higher engagement with lower promotional waste.
In subscription services, a user with falling activity is identified before a renewal date. The system delivers a message with a discounted annual plan and personalized content recommendations, increasing the chances of retention.
In B2B SaaS, declining platform usage triggers a high churn score for an enterprise client. The account manager receives an alert and schedules a check-in call to explore solutions. The feedback is also passed to the product team to inform feature development.
In financial services, credit card holders flagged as high risk receive custom offers. These may include relevant cashback categories or upgrades to better-suited plans. Offers are delivered through preferred communication channels to increase impact.
These examples illustrate how churn models support targeted, timely, and effective retention strategies. By integrating predictions into operational workflows, businesses can improve customer engagement, reduce attrition, and optimize resource allocation.
Want to do Churn Prediction or Analysis for your business?
At Mercity AI we have been doing churn prediction as a part of our consultation process. Many times people come to use for something else and we end up doing churn analysis for them as a stepping stone. But looking at the insights they gain from this, we realized that this is a very powerful tool for many businesses. And now hence we are excited to work with more businesses on this.
If you are interested in performing churn analysis for your business, feel free to reach out to us!